Client
The Laboratory of Analytical Sciences
Role
Research & Product Design
Team
Mia Biehler, Katherine Ryan, Joshua Garett
Enterprise Design for the Laboratory of Analytical Sciences (LAS)
Enterprise Design for the Laboratory of Analytical Sciences (LAS)
Enterprise Design, Product Design, Data-Visualization
The Laboratory of Analytical Sciences (LAS) is an arm of the National Security Agency partnering with academic institutions and industry to advance technology for the U.S. Intelligence Community (IC). LAS approached our team to create a new internal enterprise application for a future feature upgrade for data scientists at the senior policy level.
PROBLEM STATEMENT
How does a digital search and contextualization tool aid the Intelligence Community (IC) data analyst team leader in gathering and prioritizing global information for creating a contextualized report for domestic policymakers?
DISCOVER STAGE
But First, Let's Talk About Research.
My team and I first needed to understand the workflow of current data analysts within LAS to identify the gains and pains of their interactions with their current software interface. We did this through informant interviews. Additionally, market research played a key role in understanding the feature needs of our clients.

Informant Interviews
We interviewed three data analysts at the senior policy analyst level to gain insights into what their day-to-day looks like. From their responses, I codified recurring themes and identified these main takeaways with my team:
-
Indicated desire for reducing cognitive load when jumping back into tasks and projects.
-
Increased automated documentation for data analyzed and found for report validation.
-
More triaging tools to feed information from various team members into a consolidated report.

Market Analysis
Since we couldn't see the actual interface LAS data analysts were using for security purposes, the team and I researched data analytical software used in the industry to conclude potential feature opportunities. We deciphered the needs for:
-
Simple visual design.
-
More collaborative features.
-
Learning aids to address curve for new users.
-
AI assistance for automation.

Goals
Challenges
Needs
-
Help the Oceania community through educating policy with turnkey data.
-
Help progress his team of analysts to using state-of-the-art AI query search.
-
Often times cannot find the original source of information.
-
Finds it stressful to get a clean report done by designated timeline.
-
Organized and synthesized data that is searchable within the system.
-
An efficient tool for collecting findings into a clear, simplified report.
PERSONA
Let's Meet Christian.
“Christian is a Team Lead for the Oceania analysis team. As such, Christian and his team use a wide range of tools to help sift through relevant data sources. To get the most efficient use out of the information provided by a tool, Christian needs the tool to help drive his analysis experience by providing context and prioritization for the information being returned in his query results.”
DEFINE STAGE
User Journey Map
The informant interviews and Christian's persona as someone in more of a senior management position breaks down his current workflow into 4 phases. The phase with the most dissatisfaction and frustration comes from Synthesizing Reports, which is a stage that compounds from the previous phases. As such, my team and I realized that to address this issue, we would need to streamline the entire dashboard space for Christian so he could manage his team, triage, and contextualize reports in one systematized space.

Christian's needs centers around managing his team, and constructing reports. His user journey map indicated the major phases of his work, which allowed my team and I to develop our proposed task flow. The outcome was a manager dashboard that defined 5 spaces for his various task and context switches.
Proposed Task Flow
DEFINE STAGE
DEFINE STAGE
Proposed Task Flow
Christian's needs centers around managing his team, and constructing reports. His user journey map indicated the major phases of his work, which allowed my team and I to develop our proposed task flow. The outcome was a manager dashboard that defined 5 spaces for his various task and context switches.


SOLUTION
Streamlining Christian's Complexity


Inbox: Efficient internal & external communication.
Team: Easy task tracking & assignments with team.
Queries: Organized & quality query repository.
Initiatives: AI-assisted initiative creation & customization.
Initiatives: Efficient internal & external communication.
DEVELOP STAGE
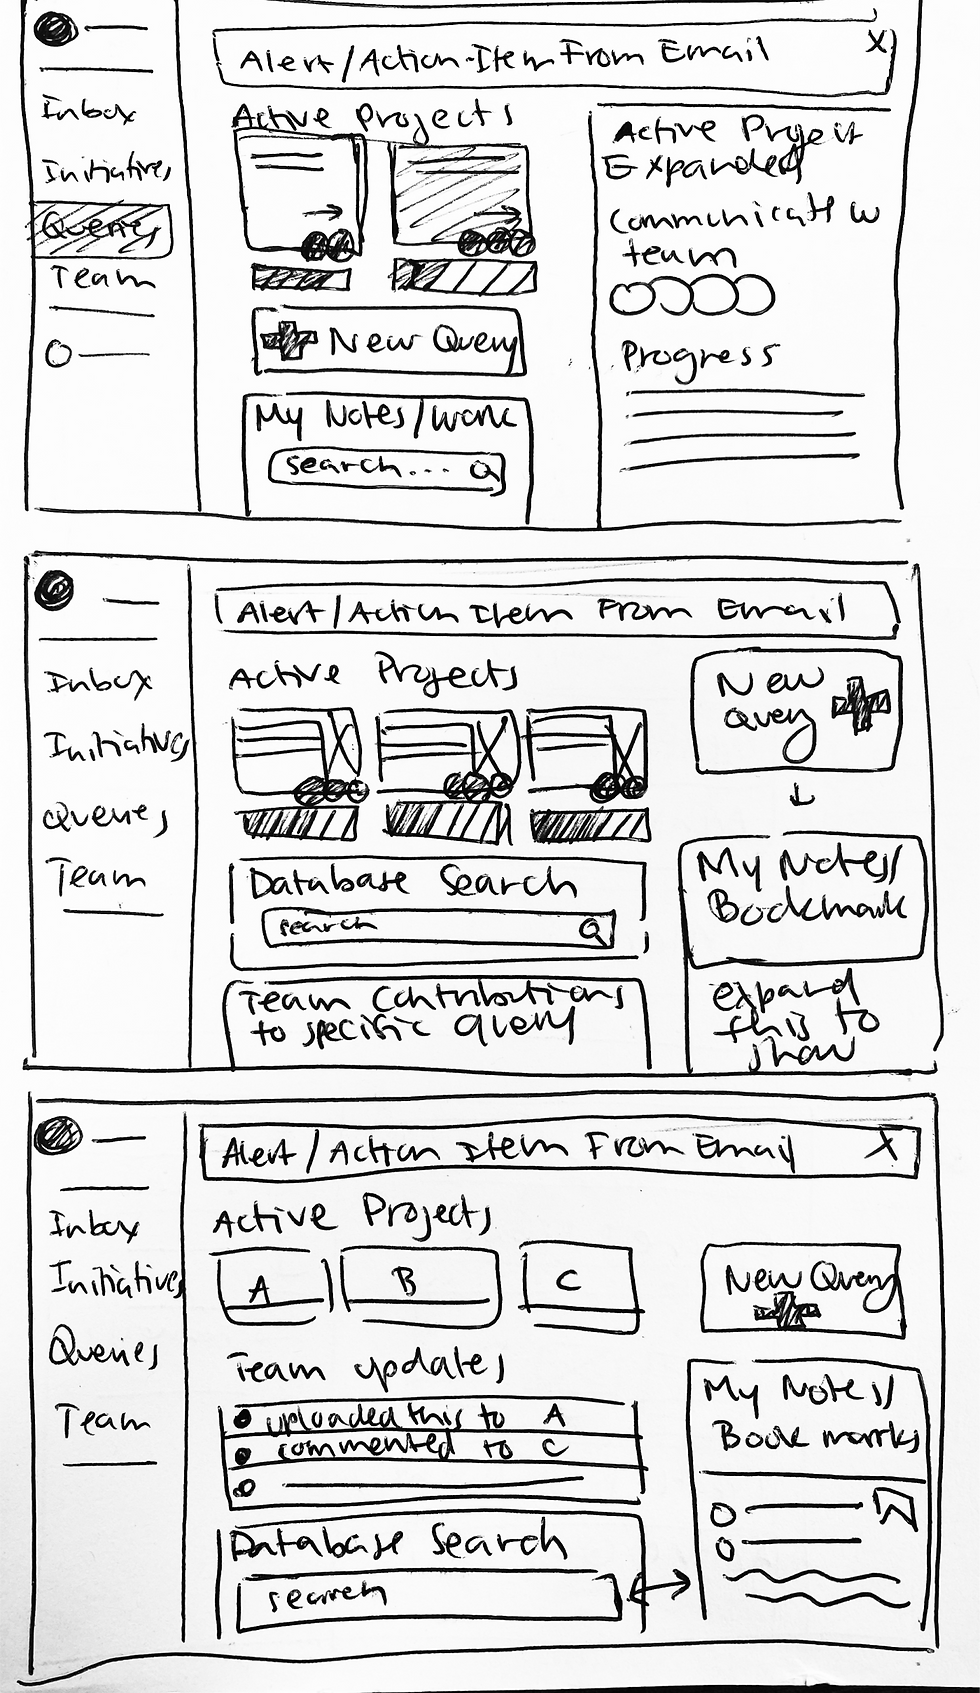
Crazy 8 Lo-Fi Mockups
Since my team and I were working on such a robust product, I knew that we needed to generate ideas quickly. I proposed each of us quickly iterate feature and layout ideas for each page, giving a minute for 8 iterations each. From that, we rated our rough iterations based on the quality of ideas and mismatched different aspects together. Some of my feature/dashboard sketches are shown below.


DEVELOP STAGE
Usability Test
Before moving on to our final high-fidelity deliverables, my team and I conducted usability tests with our mid-fidelity mockups. Our main takeaways: SIMPLIFY.
-
Simplify connections between Queries, Initiatives, and Reporting to show more collaboration between each stage.
-
Improve the clarity of site-wide navigation.
-
Clarify nodes feature in the Initiatives page.
-
Establish system of hierarchy for Christian to work with this product


The Solution: AI Assisted Enterprise Dashboard
DELIVER STAGE
My team and I designed and delivered a complete enterprise dashboard for the LAS data analytics team. The team and I wanted to overhaul his current flow right down from the moment he began his work day to show streamlining one part of each phase compounded into a more positive experience in subsequent phases of his flow. I focused primarily on the design, delivery, and prototyping of the fixed navigation, the Query page, and parts of the Initiatives page.

STEP ONE
Inbox Triage
In Inbox, Christian has all the traditional functionalities of e-mail, but there is AI assistance integrated within open e-mail sifting for key words that can prompt new initiative drafts, a query, or a follow-up. There is also a daily journal to assist to jump back into the cognitive flow from day-to-day.

STEP THREE
Tracking Queries
In Inbox, Christian has all the traditional functionalities of e-mail, but there is AI assistance integrated within open e-mail sifting for key words that can prompt new initiative drafts, a query, or a follow-up. TheQuerying is integral to what Christian does and requires from his team. In this space, I designed and developed active queries organized by their corresponding overarching initiative, previews of findings, and customized searches for better results. Additionally, all queries document files, conduct analytics, and modifications in real-time for report documentation.re is also a daily journal to assist to jump back into the cognitive flow from day-to-day.

STEP TWO
Manage Team
In Teams, Christian can seamlessly oversee everyone on his team, the active initiatives they are working on, progress, and correspondance between himself and them.

STEP FOUR
Automated Initiatives
Christian creates initiatives when new report needs are expressed to him or generated through AI from correspondence. In this space, Christian can customize his space with features such as Kanban, Gantt Charts, project timelines, etc. A key unique feature that I helped develop is the project tree, which documents every step and action taken to construct a report.

STEP FIVE
Constructing Reports
Once Christian acquires the necessary queries from his team and organizes his findings, he then writes a report. This process has been streamlined to customize template, organize sections, and have various levels of visualizations integrated into his report from data analytics conducted for the initiative.
REFLECTIONS
A Brief Conclusion
No project is truly done, just abandoned. I am proud of how my team and I moved from an abstract problem space and defined tangible feature upgrades through research. I particularly enjoyed working on the Queries page because it allowed me to explore different possible futures in how to create more customized search experiences and results. Moving forward, I would like to explore how search experiences could be tailored to different organizational levels depending on employee needs for specific roles.
STEP SIX
Notes and Chat
While Christian queries, he is able to take notes on findings from his team and his search. He can also quickly message his team at any point securely within the dashboard and reduce application switching.

